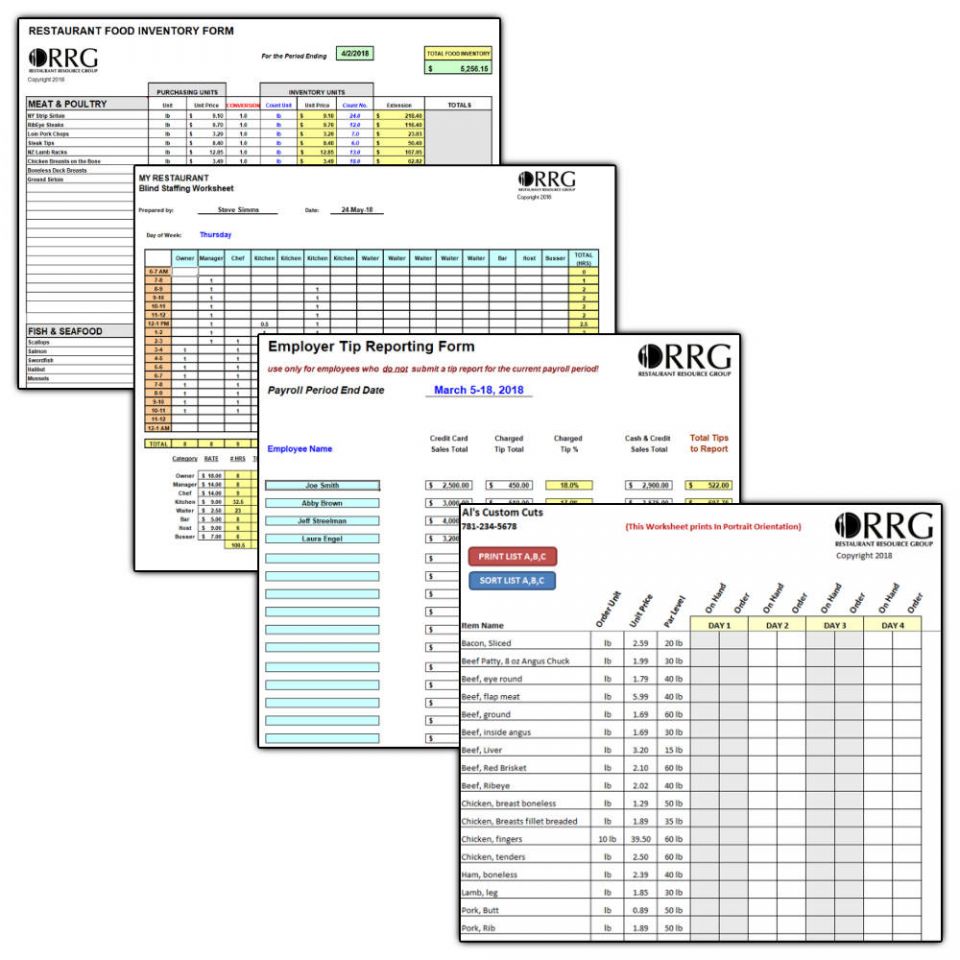
Restaurant
Operations & Management Spreadsheet Library (20)
Our Library of 20
customized Microsoft Excel Spreadsheets are designed specifically for
foodservice applications! They are configured to organize critical financial
information generated by your restaurant on a daily, weekly and/or monthly
basis; to forecast trends and help with budgeting; and even to assist you in
performing many types of "what if" analysis. But that's not
all...many are also designed to make manual entries into your accounting system
more streamlined.
Only $129
Restaurant Rules of Thumb

By Jim Laube, RestaurantOwner.com
The first and most fundamental restaurant rule
of thumb is "every independent restaurant is unique." However, rules
of thumb regarding the financial and operational aspects of restaurants can
provide a valuable starting point for evaluating and understanding the
financial feasibility and performance of proposed and existing restaurants.
Restaurants generate a lot of numbers so
particularly for those new to the industry; deciding what numbers to focus on
first and knowing what they mean can be more than a little perplexing. Rules of
thumb can help operators determine where to look first and what to expect.
This article discusses several of the
restaurant industry's basic rules of thumb. While there will always be
exceptions, they have proven to be surprisingly reliable over the years that I
have worked with operators who collectively manage thousands of diverse
restaurant operations. Keep these numbers handy when planning your restaurant
and assessing your performance after you open.
Investment Rules of Thumb
One of the primary indicators chain operators
use for evaluating the feasibility of a new location is the sales-to-investment
ratio. This ratio compares the projected annual sales of a proposed site with
its estimated startup cost. The ratio looks like this:
Sales to Investment = Annual Sales / Startup Cost
Startup cost includes all the costs necessary
to open the restaurant including leasehold improvements (or land and building),
furniture and equipment, deposits, architectural and design, accounting and
legal, preopening expenses, contingency and working capital reserve.
Sales to investment - Leasehold. When
evaluating the feasibility of a proposed restaurant in a leased space, a rule
of thumb says that the sales-to-investment ratio should be at least 1.5 to 1,
or a minimum of $1.50 in sales should be expected for every $1 of startup
costs. This means that if the cost of opening a restaurant in a leasehold
situation was estimated to be $500,000, the location should be given further
consideration only if the annual sales volume of at least $750,000 could be a
realistic expectation.
Sales to investment � Ownership of land and
building. The rule of thumb for restaurant
projects in which the operator owns the land and building calls for a
sales-to-investment ratio of at least 1 to 1, or $1 in sales for every dollar
of startup costs.
While there are many other considerations in
deciding whether to open in a particular location, this is one ratio that many
operators use as an early indicator of whether to move on to other factors in
the go/no go decision process.
Profitability Rules of Thumb
Sales per square foot. While
not all high-volume restaurants make lots of money, they do have the greatest
opportunity to generate a sizable amount of profit. Sales volume is the most
reliable indicator of a restaurant's potential for profit and a useful way to
look at sales volume when evaluating profit potential is through the ratio of
sales per square foot.
It's easy to calculate a restaurant's sales
per square foot. Just take annual sales and divide by the total interior square
footage including kitchen, dining, storage, restrooms, etc. This is usually equal
to the net rentable square feet in a leased space. The ratio looks like this:
Sales per Square Foot = Annual Sales/Square Footage
In most cases, full-service restaurants that
don't generate at least $150 of sales per square foot have very little chance
of generating a profit. For example, a 4,000-square-foot restaurant with annual
sales of anything less than $600,000 would find it very difficult to avoid
losing money. This works out to $50,000 in monthly and $12,000 in weekly sales.
Limited-service restaurants that generate any
less than $200 of sales per square foot have little chance of averting an
operating loss. Industry averages reveal that limited-service restaurants tend
to have slightly different unit economics than their full-service counterparts.
Higher occupancy costs (on a per-square-foot basis) and lower check averages
are two of the primary reasons for this difference.
At sales levels of $150 to $250 per square
foot (full-service) and $200 to $300 (limited-service), restaurants with effective
cost controls may begin to approach break-even, with some well-managed
operations able to achieve a net income of up to 5 percent of sales.
At sales levels of $250 to $325 per square
foot (full-service) and $300 to $400 (limited-service), restaurants may see
moderate profits, which are defined as 5 percent to 10 percent net income
(before income taxes) as a percentage of total sales. Generally, you don't
want management salaries to exceed 10 percent of sales in either a full- or
limited-service restaurant. This would consist of all salaried personnel.
High profit can be defined as sales levels
more than $350 per square foot (full-service) and more than $400
(limited-service). Generating sales at these levels affords the opportunity for
some operators to generate a net income (before income taxes) in excess of 10
percent of sales.
There are many factors that influence a
restaurant's profitability besides sales volume. Two of the biggest are prime
cost and occupancy costs. Without competent management and effective systems
and controls over food, beverage, labor and other operating expenses, no amount
of sales will produce much more than mediocre operating results.
Likewise, occupancy costs, which are not
controllable by restaurant management, will have a significant effect on
profitability. The sales volume rules of thumb above assume an "industry
average" occupancy cost from $15 to $22 per square foot. If your occupancy
costs are higher than $22 per square foot, the sales numbers above will be low
when using them to evaluate your restaurant's profitability.
Percentage of Cost Rules of Thumb
Food cost. Food
cost as a percentage of food sales (costs/sales) is generally in the 28 percent
to 32 percent range in many full-service and limited-service restaurants.
Often, more upscale full-service concepts, particularly those that specialize
in steaks and/or fresh seafood can have food cost of 38 percent, 40 percent and
even higher. Conversely, I'm familiar with some gourmet pizza restaurants in
upscale areas that are able to consistently achieve a food cost of 20 percent
and sometimes even less. Some people might be surprised that some of the most profitable
restaurants in our industry have a food cost in excess of 40 percent.
Alcoholic beverage costs. Alcohol
costs vary with the types of drinks served. Among the reasons that bar service
is so desirable are both the relative profitability of alcohol and the ability
to control costs, as long as servers are trained to pour accurately, and theft
is not a significant problem. Below are typical costs in percentages:
� Liquor - 18 percent to 20 percent.
� Bar consumables - 4 percent to 5 percent as a
percent of liquor sales (includes mixes, olives, cherries and other food
products that are used exclusively at the bar).
� Bottled beer - 24 percent to 28 percent
(assumes mainstream domestic beer, cost percent of specialty and imported
bottled beer will generally be higher).
� Draft beer - 15 percent to 18 percent
(assumes mainstream domestic beer, cost percent of specialty and imported draft
beer will generally be higher).
� Wine - 35 percent to 45 percent (the cost percentages of
wine can vary dramatically from restaurant to restaurant depending primarily on
the type of wines served. Generally, the higher the price per bottle, the higher
the cost percentage).
Non-alcoholic Beverage costs. It
is standard industry practice to record nonalcoholic beverage sales and costs
in Food Sales and Food Cost accounts, respectively:
� Soft drinks (post-mix) - 10 percent to 15 percent
(another rule of thumb for soft drinks is to expect post-mix soda to cost about
a penny an ounce for the syrup and CO2).
� Regular coffee - 15 percent to 20 percent
(assumes 8-ounce cup, some cream, sugar and about one free refill).
� Specialty coffee - 12 percent to 18 percent
(assumes no free refills)
� Iced tea - 5 percent to 10 percent iced
tea is the low food cost champ of all time. Cost of the tea can be less than a
penny per glass. Biggest cost component in iced tea is usually the lemon slice.
Paper cost. In
limited-service restaurants paper cost should be classified as a separate line
item in "cost of sales." Historically, paper cost has run from 3
percent to 4 percent of sales. However, the recent run-up in the cost of many
paper goods has increased the paper cost percentage to more than 4 percent of
sales in many restaurants. In full-service restaurants, paper cost is usually
considered to be a direct operating expense and normally runs from 1 percent to
2 percent of total sales.
Payroll
and Salaries. Payroll cost as a percentage of sales includes
the cost of both salaried and hourly employees plus employee benefits, which
includes payroll taxes, group, life and disability insurance premiums, workers'
compensation insurance premiums, education expenses, employee meals, parties,
transportation and other such benefits. Total payroll cost should not exceed 30
percent to 35 percent of total sales for full-service operations, and 25
percent to 30 percent of sales for limited-service restaurants.
Generally, you don't want management salaries
to exceed 10 percent of sales in either a full- or limited-service restaurant.
This would consist of all salaried personnel including general manager,
assistant manager(s), chef or kitchen manager.
One caveat on this would be in a situation in
which a working owner fulfills the role of the general manager and/or chef and
takes a salary in excess of 3 percent to 4 percent of sales. When this occurs,
management salaries can easily exceed 10 percent of sales and total payroll
cost can appear excessive as well.
Hourly Employee Gross Payroll
� Full-service Restaurant - 18 percent to 20 percent
� Limited-service Restaurant - 15 percent to
18 percent
Limited-service restaurants generally have
lower hourly payroll cost percentages than full-service restaurants. In
limited-service restaurants, managers often perform the work of an hourly
position in addition to being a manager. In some cases, however, hourly workers
may also perform management roles on some shifts, which could lead to higher
hourly payroll costs in these restaurants.
Employee Benefits
� 5 percent to 6 percent of total sales
� 20 percent to 23 percent of gross payroll
Employee benefits can vary somewhat depending
primarily on state unemployment tax rates and state workman's compensation
insurance rates. California, for example, has had for the past several years
very high workers' compensation premium rates as compared with rates in other
states. Restaurants that are new or have had a large number of unemployment
claims may have state unemployment tax rates that could cause their employee
benefits to be higher than the rules of thumb above.
Prime Cost Rules of Thumb
Prime cost is one of the most telling numbers
on any restaurant's profit-and-loss statement. Prime cost is arrived at by
adding cost of sales and payroll costs. Prime cost reflects those costs that are
generally the most volatile and deserve the most attention from a control
standpoint. It's very easy to lose money due to lax or nonexistent controls in
the areas of food, beverage and payroll. Many successful restaurants calculate
and evaluate their prime cost at the end of each week. In the chart, if total
sales were $60,000, then prime cost would be running $39,100 or 65 percent of
sales.
Prime Cost
� Table-service - 65 percent or less (total
sales)
� Limited-service - 60 percent or less (total sales)
As prime cost exceeds the above levels it becomes increasingly difficult to
achieve and maintain an adequate bottom-line profit in most restaurants. When
looking at a restaurant's overall cost structure, prime cost can be very
meaningful, particularly in cost of sales and payroll cost. Some restaurants,
such as steak and seafood restaurants, may carry very high food cost and yet be
extremely profitable. Again, this can be exhibited by looking at prime cost.
People might be surprised that some of
the most profitable restaurants in our industry have a food cost in excess of
40 percent. I'm familiar with a seafood restaurant outside of a major Midwest
city that, according to reliable sources, consistently operates with a food
cost of 45 percent or higher, which is not all that uncommon in restaurants
specializing in high-quality steak and/ or seafood.
You might be thinking, though, how any
restaurant could make money let alone be highly profitable when its food cost
gets close to 50 percent of sales. Well this particular restaurant does more
than $20 million in annual sales in about 20,000 square feet. This means that
its sales are more than $1,000 per square foot, which is among the highest in
the industry.
Even though their food cost is as high as say
45 percent, what do you think their labor cost is as a percentage of sales when
they generate a sales level this high? I'm fairly certain it's much lower than
the industry average, which is around 30 percent to 35 percent. In fact, their
payroll, including management, hourly staff and taxes and benefits is probably
around 15 to 18 percent of sales, but let's say it's 20 percent to be
conservative.
Let's also assume that their sales mix is 85
percent food and 15 percent liquor, beer and wine. If their combined beverage
cost is, say, 25 percent of beverage sales. If our assumptions about beverage and payroll
costs are fairly accurate, you can see that its prime cost is well below the 65
percent threshold. This means that even with a very high food cost, this
particular restaurant should be very profitable, assuming its remaining costs
and expenses are in line with restaurant industry averages.
Some restaurants, like many ethnic concepts,
have relatively low food costs, with some well under 30 percent of sales. You
might think that these restaurants would be extremely profitable. They might
be, but often these restaurants have lower check averages and are more labor
intensive, so their payroll costs are much higher as a percentage of sales
than, say, a steak or seafood restaurant.
Looking at cost of sales and payroll costs
together as prime cost usually provides a much more meaningful and valid
indication of a restaurant's cost structure and potential for profit.
Rent and Occupancy Cost Rules of Thumb
Rent (6 percent or less). Rent used here is the ongoing payments made by an operator to the lessor for the use of premises. Rent payments may be fixed or based on a percentage of sales. Generally, the goal is to limit rent expense to 6 percent of sales or less, exclusive of related costs such as common area maintenance (CAM) and other occupancy expenses.
Occupancy cost (10 percent or less). Occupancy
cost includes rent, CAM, insurance on building and contents, real estate taxes,
personal property taxes and other municipal taxes. Many operators want to keep
occupancy cost at or below 8 percent of sales, however, 10 percent is generally
viewed to be the point at which occupancy cost starts to become excessive and
begins to seriously impair a restaurant's ability to generate an adequate
profit.
Sales Value of Restaurant Business Rules of Thumb
Accurately determining the potential sales
value in any restaurant requires the services of a professional business
appraiser, preferably with experience appraising independent restaurants.
However, there are two rules of thumb that may
be helpful to arrive at an initial, rough estimate of what your restaurant may
be worth, assuming you operate in leased space:
�
Sales value of business (gross sales method) - 38 percent to
42 percent of gross sales.
� Sales value of business (cash flow method) - annual cash flow (basically net income before depreciation, debt service and owner compensation) times a multiple of three to four.
When determining the value of a restaurant in leased space, one of the most important determinants is the terms, particularly the transferability and the amount of time, with options, remaining on the existing lease. Lease factors such as these and other terms can have a significant effect on the value of any business.
In restaurants where the operator owns the
land and building, the inherent value of the business will be influenced
significantly by the underlying value of the real estate. For this reason it is
difficult to value the business in a meaningful way using rules of thumb.
Final Rule of Thumb: Not Every Rule of Thumb Fits Every
Restaurant
Most restaurants will probably deviate from
one or more of the rules of thumb discussed in this article. That's to be
expected. Rules of thumb, as discussed above, are merely guidelines, not an
ironclad collection of industry mandates from which no successful restaurant
can deviate.
Where your numbers do stray from these norms,
it may be useful to determine "why." Determining the reasons for any
differences may prove to be an insightful process in learning more about the
financial and operating nuances of your restaurant.
Another rule of thumb says that the more you
understand how your restaurant works, the better the manager you will become.
Using these rules of thumb could go a long way in helping to better understand
your restaurant and provide insights for building a more successful business.
At a Glance: Rules of Thumb
Sales to Investment (Annual Sales/Startup Cost)
�
Leasehold - at least 1.5 to 1.
�
Own land and building - at least 1 to 1.
Sales Per
Square Foot
�
Losing Money Full-service - $150 or less.
Limited-service - $200 or less.
�
Break-even Full-service - $150 to $250. Limited-service -
$200 to $300.
�
Moderate Profit Full-service - $250 to $350.
Limited-service - $300 to $400.
�
High Profit Full-service - More than $350. Limited-service
- More than $400.
Food Cost
�
Generally - 28% to 32% as a percentage of
total food sales.
Alcoholic Beverage Costs
�
Liquor - 18% to 20% as a percentage of liquor sales.
�
Bar consumables - 4% to 5% as a percentage of
liquor sales.
�
Bottled beer - 24% to 28% as a percentage of
bottled beer sales.
�
Draft beer - 15% to 18% as a percentage of
draft beer sales.
�
Wine - 35% to 45% as a percentage of wine sales.
Nonalcoholic
Beverages
�
Soft drinks (post-mix) - 10% to 15% as a
percentage of soft drink sales.
�
Regular coffee - 15% to 20% as a percentage of
regular coffee sales.
�
Specialty coffee - 12% to 18% as a percentage of
specialty coffee sales.
�
Iced tea - 5% to 10% as a percentage of
iced tea sales.
Paper
Cost
�
Full-service - 1% to 2% as a percentage of
total sales.
�
Limited-service - 3% to 4% as a percentage of
total sales.
Payroll
Cost
�
Full-service - 30% to 35% as a percentage of
total sales.
�
Limited-service - 25% to 30% as a percentage of
total sales.
Management Salaries
�
10% or less as a percentage of total sales.
Hourly Employee Gross Payroll
�
Full-service - 18% to 20% as a percentage of
total sales.
�
Limited-service - 15% to 18% as a percentage of
total sales.
Employee
Benefits
�
5% to 6% as a percentage of total sales.
�
20% to 23% as a percentage of gross payroll.
Prime
Cost
�
Full-service - 65% or less as a percentage of
total sales.
�
Limited-service - 60% or less as a percentage of
total sales.
Occupancy
and Rent
�
Rent - 6% or less as a percentage of total sales.
�
Occupancy - 10% or less as a percentage of
total sales.

